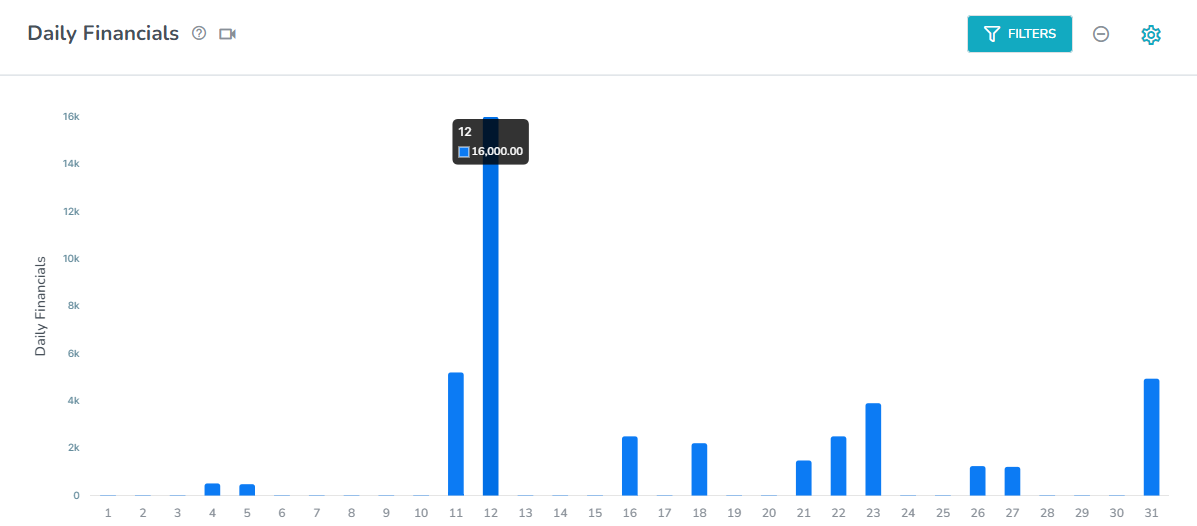
In the Daily Financials section under Revenue, you'll be presented with information on the daily financials such as daily revenue, occupancy % and revenue per guest.
First, there is a graph showing the total daily revenue for the selected month.
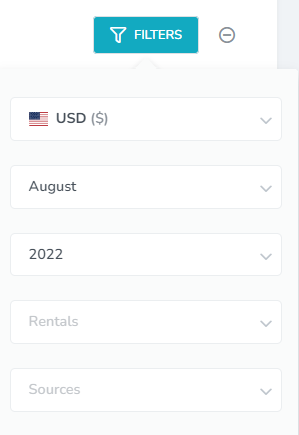
The Filters button allows you to only show information based on the currency, month, rentals and sources.
The Daily Financials Summary shows a breakdown of your daily revenue based on the fields below.
It also allows you to print and download the data as a CSV or Excel file.
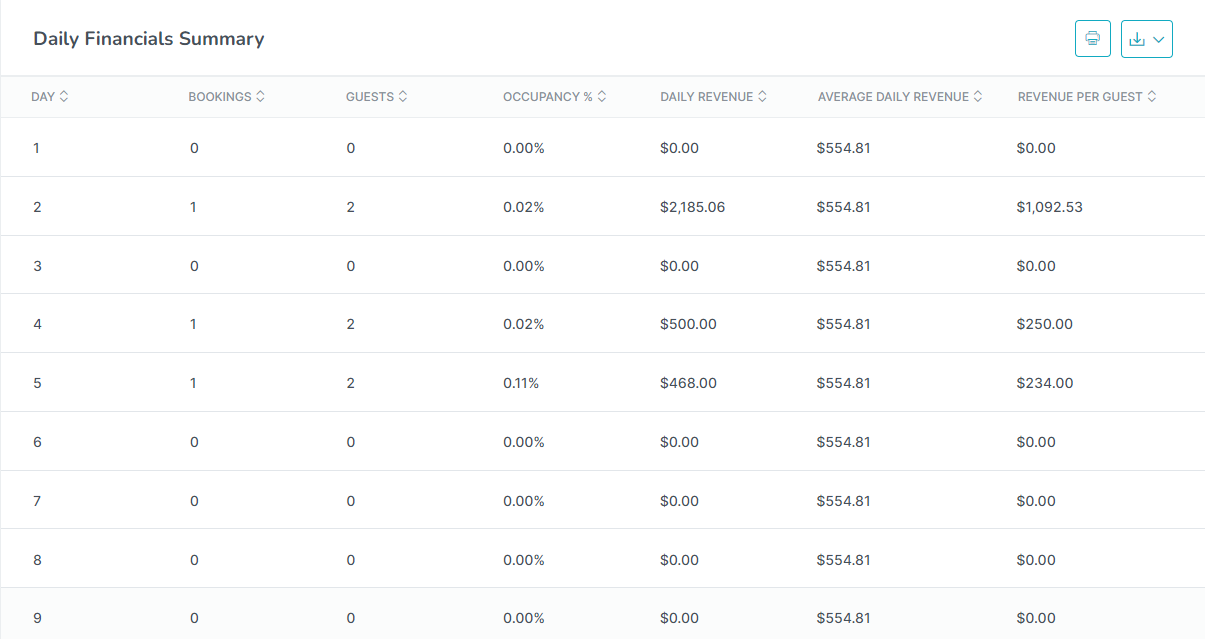
Bookings: No. of bookings on that day
Guests: Sum of guests having booking on respective date
Occupancy: Occupancy % for respective month [i.e. bookedNightsInaDay / (daysInMonths * RentalsCount) * 100]
Daily Revenue: Sum of Revenue of respective date
Avg daily revenue: Total average revenue against a respective date w.r.t. month [i.e. Total month Revenue/daysInMonths]
Revenue per guest: Daily revenue w.r.t. guest [i.e. Dailyrevenue/no. of guests]