In the Monthly Financials section under Revenue, you'll see a graph showing the total monthly revenue, as well as a table showing how the finances were distributed each month.

The Filters button allows you to only show information based on the currency, year, booking status, rentals and sources.

The Monthly Financials table shows your occupancy %, average daily rate, gross total, and net total. It also allows you to print and download the data as a CSV or Excel file.
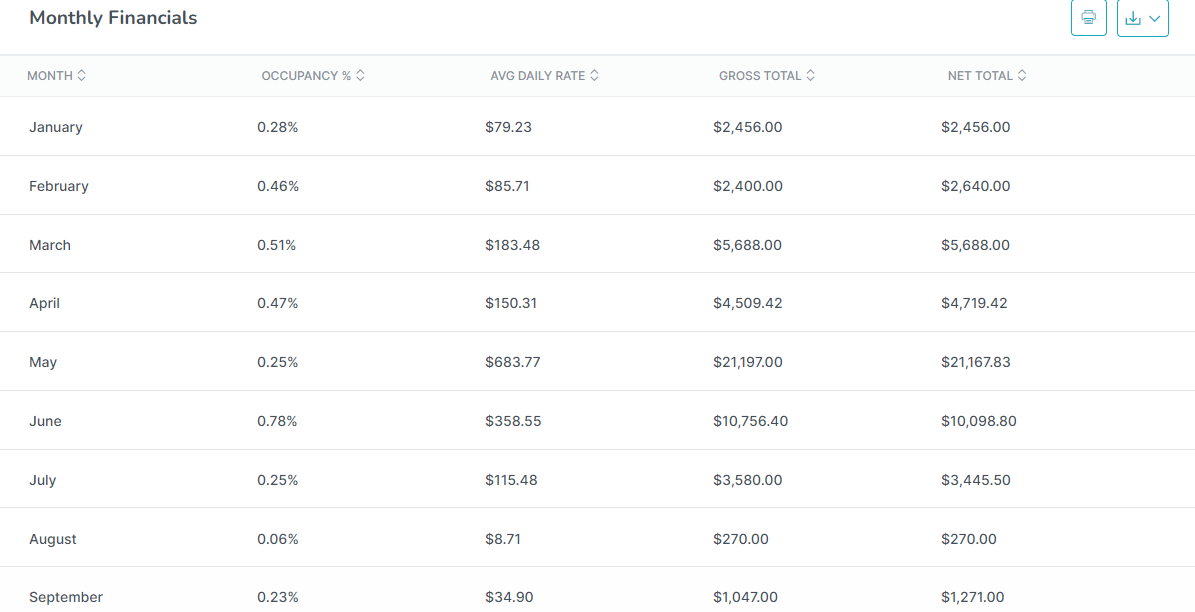
Occupancy: Occupancy % for respective month [i.e. bookedNightsInMonth / (daysInMonths * RentalsCount) * 100]
Avg daily rate: Net total w.r.t. total month days
Gross total: Sum of Gross Revenue
Net total: Sum of Net Revenue
As always, please contact us with questions at any time. We're happy to help.