The Monthly Channel Occupancy Report allows you to see your monthly distribution of inquiries broken down by channel.
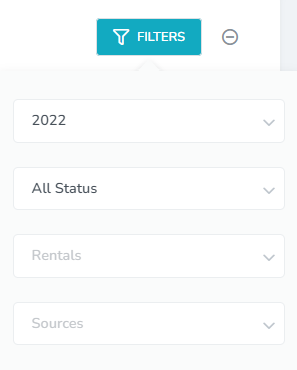
At the top of the page, you will see a Filters button allowing you to choose what you'll like to see in the different sections below.
You can filter by year, booking status, rentals and sources.
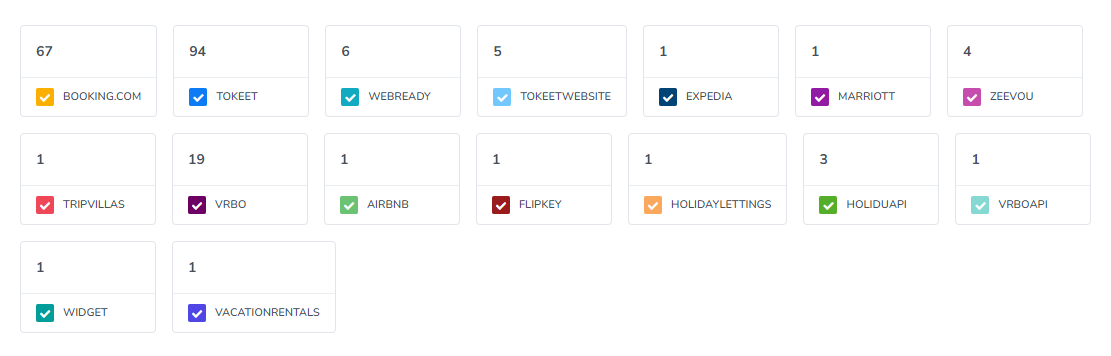
The first section gives a count of the inquiries for each connected channel with a checkbox allowing you to deselect channels that you'll like to exclude from the graph below.
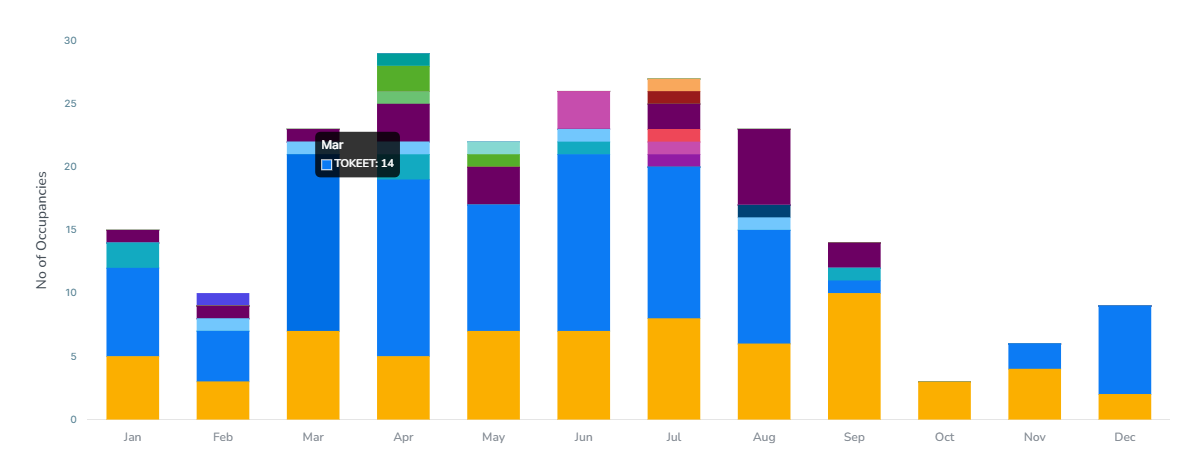
Next, you'll find your occupancy chart which shows your total occupancy for your selected channels for each month.
Monthly Channel Occupancy Summary
Here you will see your occupancy count for each channel every month.
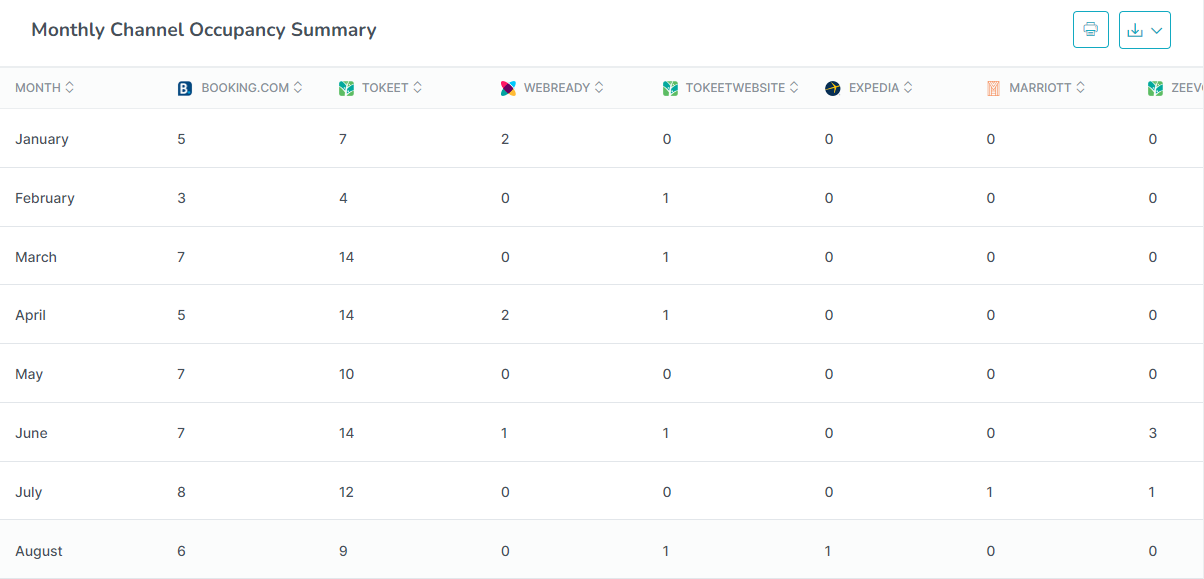
You will be able to print or download the information as CSV or Excel using the available icons.